Rebuilt on AG-Grid
The data viewer in NoSQLBooster 11.0 has been completely rebuilt on AG-Grid, delivering significantly improved performance and functionality:
- WebGL-accelerated rendering — large datasets render with hardware acceleration for smooth scrolling
- Nested field column groups — nested document fields are automatically organized into collapsible column groups (e.g.,
address.city,address.zipare grouped underaddress) - Column state persistence — column widths, ordering, and visibility are remembered between sessions
- Inline cell editing — press Enter on any editable cell to modify values directly in the table
- Encrypted field detection — CSFLE/Queryable Encryption fields are clearly marked in the data view
- DBRef follow reference — clicking a database reference opens the related document in a new shell tab
Tree, Table, and JSON View
NoSQLBooster lets you view data in three ways. All three views allow you to add, delete, and modify data.
- The tree view Ctrl-1 displays data in a hierarchy that you can expand or collapse as needed. The tree view supports edit data in-place.
- The table view Ctrl-2 shows your data as in a spreadsheet format, support sorting, resizing, displaying or hiding columns.
- The JSON View Ctrl-3 shows your data in JSON.

Three JSON view format
JSON view has three formats. MongoDB shell format is actually js code, which can be copied and pasted into mongo script. MongoDB Extended Type-conserving EJSON format is more suitable for data exchange. The new plain JSON is simple human-readable pure JSON text, losing type information.

Mark Types With Colors
Give different colors to different types, making the data easier to identify and view. If this looks a little too flashy, you can use the option "Menu -> Options -> Output Panel -> Mark Types with Colors" to turn it off.

One-click Grouping/Filtering
This handy One-Click grouping feature allows grouping of the selected field in query results to calculate counts, totals, minimums, maximums, and averages with a single click. One-click filtering enables the filtering of the selected field-value pairs in query results.

For date fields, grouping by a certain point in time is not practical. We have enhanced grouping of date and time fields. The one-click grouping function will be grouped by day (formatted by $dateToString operator), and users also modify the generated code to support more date ranges.
The $dateToString operator converts a date object to a string according to a user-specified format. The date must be a valid expression that resolves to a Date, a Timestamp, or an ObjectID. Please refer to this page for format descriptors.

Tooltip for Array, Object and ObjectId Values
How to display the array, object values in the data view is often a bit of a hassle. In NoSQLBooster, we add a more friendly tooltip for the array, object, and ObjectId values.

Preview Images in Binary Fields

Visualizing GeoJSON Objects
NoSQLBooster allows users to visualize the MongoDB GeoJSON Objects quickly. The GeoJSON is a format for encoding geographical data structures, using the JavaScript Object Notation (JSON).

AG-Grid Nested Field Column Groups
The data viewer automatically organizes nested document fields into collapsible AG-Grid column groups. For example, fields like address.city, address.zip, address.street are grouped under an address parent group, and order.customer.name becomes nested under order → customer. This makes deeply structured MongoDB documents much easier to navigate and analyze at a glance.
You can expand or collapse any column group with a single click, and column widths, ordering, and visibility are all persisted between sessions.
Table-View | Column chooser
The newly designed column chooser can easily select fields or embedded fields. You can also see that more functions have been added in the header context menu of the table.
After selecting the fields, you can also use the right-click menu to save the query results view as a MongoDB read-only view (Include Visible Columns or Exclude Hidden Columns)

Table-View | Column-moving and freeze columns
To move a column, just drag the column's header to the desired position. You can also drag the column to the frozen zone to freeze some fields so that they do not scroll out of view. The _ id field is located in the frozen zone by default.

Faster Tab Switching and Tab Switcher
We reduced unnecessary DOM reflows, greatly speeding up the response time for tab switching. The new tab switcher also provides more convenience for tab switching.
The following picture shows the tab switcher, and the orange item indicates that the tab is being debugged.

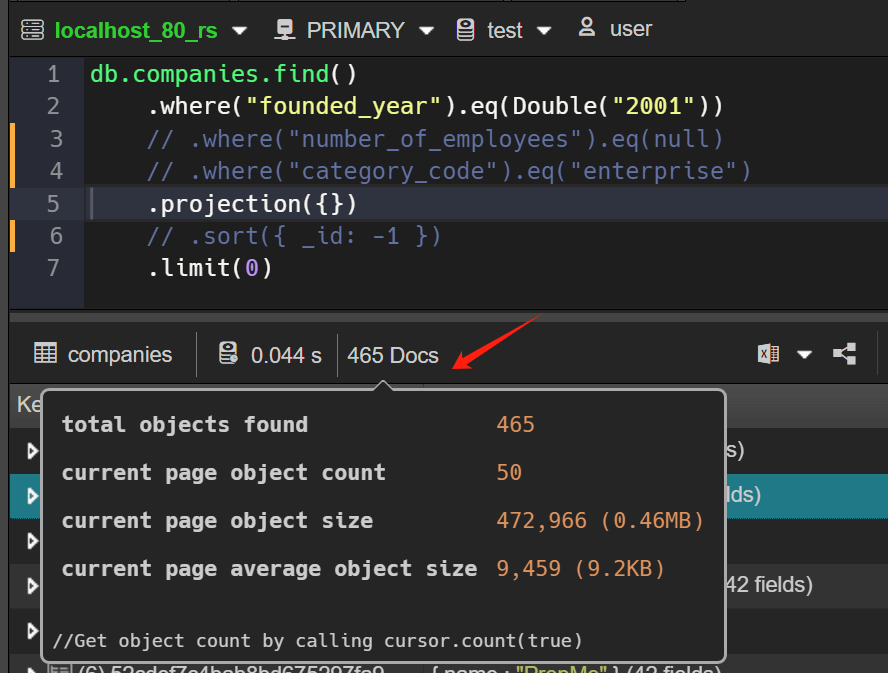
Indicate query result size, avg size
Sometimes a query may be (or seem) fast, but have some deeply nested results or individual items containing a large number of embedded items. The V9 added an indicator to show the (average) size of the query/aggregate results. This way, developers can get a rough estimate of how much traffic the query will generate and take it into account, e.g. by adding a prediction, limiting the date, or other methods.
Other Notable Improvements for the Data View
- More copy options, Copy value/key-value pair/document as plain JSON text or Mongo Shell JSON value.
- One-click save query results as MongoDB read-only view, Pop-up right-click menu, click "Save This Query as MongoDB Read-only View."
- Table view, highlight selected field when view document, When you open the "View Document" dialog within table view, automatically scrolls and highlights to the selected field.
- JSON view, allow view, add, edit and remove document within JSON View.